How do you get more from the propensity-to-pay score you pay for?
Treat a propensity-to-pay score as the starting value for each account, not the final word. The score is read from the consumer’s credit or public record file, plus any account data you send, on the day you request it, and your calls, promises and broken promises never reach it. So start from the vendor’s number, turn it into the dollars the next right-party contact is likely to bring in, and update that value after every contact. We call that next contact value. It keeps what you paid for and adds what your collectors learn on the phone, and a ready-made calculator in Google Sheets or Excel does the sums.
New to BestPair? See what it is and how it works
The short answer
Many US collection floors pay for a propensity-to-pay score, also called a collection or recovery score. You send a scoring file of your accounts to a scoring company, a score comes back for each one, and the dialer works the list from the top. That score is a snapshot of the consumer’s credit or public record file on the day you asked. It does not change because your team reached someone, took a promise to pay or watched that promise break. Your collectors can tell when an account has gone cold after a couple of broken promises. The score still says what it said on the day the account arrived.
The score is still worth having. The way to get more from it is to use it as a starting value and let your own floor move that value after every contact.
Try it on your own accounts
Change any number below and the values move. The three accounts start as Maria, James and Sarah from the examples further down, 37 days after placement: the vendor scores all three the same, but what has happened on the floor puts Sarah first. Count conversations, promises and broken promises since the account was placed.
| Account | Vendor chance (%) | Balance ($) | Days since placement | Calls, no commitment | Promises made | Promises broken | Value when placed | Next contact today |
|---|---|---|---|---|---|---|---|---|
| Maria | 20% | $1,000 | 37 | 2 | 2 | 2 | $117 | $30 |
| James | 20% | $2,000 | 37 | 2 | 2 | 2 | $237 | $63 |
| Sarah | 20% | $1,000 | 37 | 0 | 0 | 0 | $117 | $102 |
For more accounts, your own weights, or a vendor score rather than a percentage, use the full calculator in Google Sheets. Its Start here tab explains how it works, and clicking any grey cell shows the formula behind it.
- Make your own copy in Google Sheets. You need to be signed in to a Google account. The copy is yours and private, and the original stays as it is for the next person.
- Download it for Excel. The same calculator as an Excel file.
Nothing you type into either one is sent to BestPair. The weights are made-up examples, the same as on this page; the section on setting the weights further down explains how to find your own. Please read About this page and calculator, near the end, before you rely on it.
How vendor collection scores work
Vendor scores come in two kinds.
Chance of paying. These rank accounts by how likely each is to pay something within a set window. TransUnion’s Recovery Propensity Score, announced in 2011, "predicts the likelihood that an account will pay $50 or more within 12 months" (insideARM). Equifax’s Recovery Navigator predicts the likelihood that a charged-off account will make a payment within 12 months, on a scale of 1 to 999 (Auto Remarketing).
Expected dollars. These add how much an account is likely to pay. TransUnion’s Recovery Yield Score was launched alongside its propensity score to identify consumers likely to pay more. Experian’s PriorityScore for Collections gives both: the likelihood a payment is made within six months, and an expected recovery amount.
To produce either kind, the vendor matches each account to the consumer’s credit or public record file, adds any account data you send, reads it on that day and scores it with its own model. Experian says PriorityScore uses "credit, non-credit and account-level data", so some of your own account fields can go in. What happens on your calls does not. The score moves when the file changes and you ask again, and Experian’s Collection Triggers can tell you when that happens, on events such as new employment, recent credit inquiries and new credit lines. A chance-of-paying score also often leaves balance out, so a small debt and a large one can carry the same number.
What the score cannot see
Everything your floor learns after the first call: a promise to pay, a kept or broken promise, a partial payment, a refusal, a hardship, a dispute, or a run of conversations that went nowhere. In our view these are some of the strongest signals an agency has about the next call, and none of them reach the vendor. What account data predicts payment covers the account-side inputs.
Next contact value
Next contact value is the dollars the next right-party contact on an account is likely to bring in. It starts from the vendor’s chance of paying and moves after every conversation, promise, payment or broken promise. If your vendor gives a score rather than a percentage, the calculator’s Score to chance tab turns it into one, from your own history of which scores paid. If it gives only expected dollars, ask for its chance-of-paying figure too: Experian’s PriorityScore, for one, gives both.
Take the vendor’s chance of paying, adjust it for everything that has happened on the floor, then multiply by the dollars you expect if they do pay. In the examples a payer pays 60% of the balance.
Next contact value = chance of paying today × expected dollars if they pay, minus the cost of the call
The chance of paying today starts at the vendor’s number and is then pushed up or down by each event. A promise to pay pushes it up. In our view a broken promise pushes it down, usually further than the promise pushed it up. A conversation with no commitment nudges it down a little, as does every week the account ages. The calculator does the sums for you.
One consumer, eight weeks
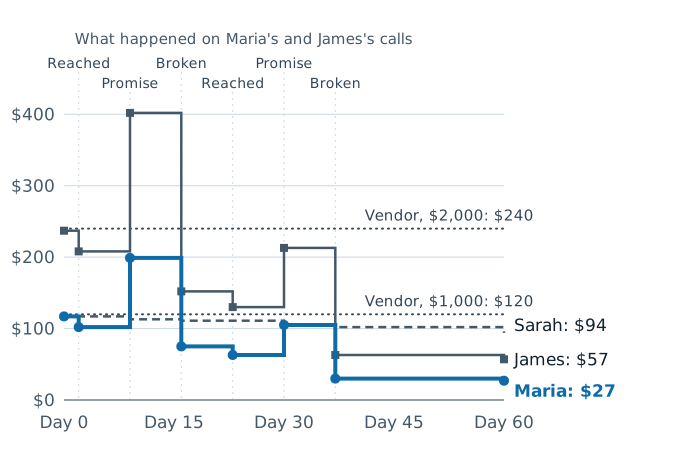
The examples below use made-up numbers and weights, listed under About the numbers. In this one, after two broken promises, a $1,000 account is worth $30 on the next contact. The vendor still says $120.
Maria owes $1,000. The vendor gives her a 20% chance of paying and an expected $120 (a 20% chance of paying about $600, since a payer usually pays about 60% of the balance), and that never changes. A call costs about $3. Over the next eight weeks the floor reaches her four times (a right-party contact each time).
| Day, and what happened | Our chance of paying | Value of the next contact |
|---|---|---|
| Day 0: placed, not yet reached | 20.0% | $117 |
| Day 2: reached, no payment | 17.6% | $102 |
| Day 9: reached, promises $150 by day 16 | 33.7% | $199 |
| Day 16: promise broken | 13.0% | $75 |
| Day 23: reached, no payment | 11.1% | $63 |
| Day 30: reached, promises again | 18.0% | $105 |
| Day 37: second promise broken | 5.5% | $30 |
| Day 60: three weeks with no contact | 5.0% | $27 |
The vendor’s 20% and $120 never move. Our number climbs when Maria promises to pay, then falls below where it started each time she doesn’t. From day 37 to day 60 nothing happens, so only the account’s age moves it, a little further down.
Same history, double the balance
In this example, doubling the balance doubles the dollars at stake, but after the same two broken promises the account is worth $63.
Now give Maria’s exact history to James, who owes $2,000. The vendor gives him the same 20% chance, so its expected dollars double to $240.
| Day, and what happened | Chance of paying | Value of the next contact |
|---|---|---|
| Day 0: placed, not yet reached | 20.0% | $237 |
| Day 2: reached, no payment | 17.6% | $208 |
| Day 9: reached, promises a payment by day 16 | 33.7% | $402 |
| Day 16: promise broken | 13.0% | $152 |
| Day 23: reached, no payment | 11.1% | $130 |
| Day 30: reached, promises again | 18.0% | $213 |
| Day 37: second promise broken | 5.5% | $63 |
| Day 60: three weeks with no contact | 5.0% | $57 |
The bigger balance doesn’t rescue a cold account. After two broken promises, James’s next contact is worth $63, about a quarter of the $240 the vendor’s figure still claims, and less than Sarah’s $1,000 account that nobody has called yet.
The account nobody has called
In this example, an untouched $1,000 account is still worth $102 on day 37, more than three times Maria’s $30, even though the vendor scores them the same.
Sarah also owes $1,000 and got the same vendor score as Maria. Nobody has reached her yet, so the only thing that changes her value is time.
| Day, and what happened | Our chance of paying | Value of the next contact |
|---|---|---|
| Day 0: placed, not yet reached | 20.0% | $117 |
| Day 9: no contact | 19.4% | $113 |
| Day 16: no contact | 18.9% | $111 |
| Day 30: no contact | 18.0% | $105 |
| Day 37: no contact | 17.6% | $102 |
| Day 60: no contact | 16.2% | $94 |
With no history, the value stays close to the vendor’s number and drifts down slowly as the debt ages. This is where the vendor score earns its keep: it is the best information you have about someone you haven’t spoken to. The moment you do speak to them, your own floor becomes the better source.
What the floor sees and what the score sees
What this means for collections teams
On day 37, a dialer sorted by the vendor’s expected dollars would call James first, with Maria and Sarah tied second. Sorted by next contact value, it calls Sarah first by a wide margin, with James and Maria far behind.
| Account on day 37 | Vendor’s expected dollars (rank) | Next contact value (rank) |
|---|---|---|
| Sarah, $1,000, never reached | $120 (2nd, tied) | $102 (1st) |
| James, $2,000, two broken promises | $240 (1st) | $63 (2nd) |
| Maria, $1,000, two broken promises | $120 (2nd, tied) | $30 (3rd) |
The vendor score is a good place to start, and nobody should throw it away. But it measures the person on the day the file was sent. Next contact value measures the next phone call, today, using what your collectors already know. That means:
- Collector time goes where the dollars are now, not where they were at placement.
- Promises move the order. A fresh promise lifts an account up the list for a follow-up; a broken one moves it down.
- Balance counts. With the same chance of paying, a bigger debt is worth more.
- It works with what you already buy. It starts from your vendor’s chance of paying, or from its score turned into one.
The formulas
Every formula is in the calculator. In your copy, click any grey cell to see the formula behind it. The Weights tab holds every number the formulas use, and the Start here tab explains each step in plain words.
Setting the weights for your own floor
The weights on this page are made up. Yours should come from your own history, and you can start simply.
- Pull every right-party contact from the last year or two: its date, the account’s vendor score and balance at the time, what happened on the call, and whether a payment followed within 30 days.
- For a quick first weight, take one event at a time. Compare how often accounts paid after that event with how often similar accounts paid without it, and take the difference in log-odds. If accounts with a fresh promise paid 35% of the time and similar accounts without one paid 20%, the promise weight is ln(0.35 ÷ 0.65) - ln(0.20 ÷ 0.80) = -0.62 + 1.39 = 0.77.
- To set all the weights together, fit a logistic regression on the whole table, with the vendor’s log-odds, balance, age and each event as inputs. Statistics software does this directly, and Excel’s Solver can too. The numbers it returns are your weights. A weight that comes out near zero means that event doesn’t move payment on your floor, so drop it.
- Set the share paid the same way, using only the contacts that led to a payment: share of balance paid, against balance and payment history.
- Check the weights on a later period you didn’t use to set them, comparing predicted pay rates with what actually happened.
- Then test it live. Split queues at random between next contact value order and your current order for a few weeks, and compare dollars collected per hour.
Where the collector comes in
The value of the next contact also depends on who makes it. Two collectors who reach Maria on day 37 do not have the same chance of turning the next conversation into a payment: collectors convert differently on different kinds of account, and in our view an account that has gone cold with one collector can sometimes respond to another, though there are good arguments both ways. Should a broken promise go back to the same collector? looks at that choice, and why collectors convert at different rates explains the gap.
That is the decision BestPair works on. The agency keeps its scores and its order of work, including any reordering by next contact value; BestPair decides which collector works each account, from the floor’s own call and payment history, and measures the result against a control group. How agent matching differs from a propensity score sets out how the two fit together.
About the numbers
Maria, James and Sarah are made up, and so are the weights. They are set to show how next contact value behaves, not to forecast any real portfolio. On a real floor every weight is fitted on the agency’s own history of right-party contacts and payments. The assumptions behind these examples:
- Vendor chance of paying: 20%, the same for all three accounts.
- A payer pays 60% of the balance: $600 on $1,000 and $1,200 on $2,000. On a real floor bigger balances often settle for a smaller share; the share can be set from your own payment history.
- Events, on the scorecard scale: promise +0.9, broken promise -1.2, second promise +0.6, second broken promise -1.3, conversation with no commitment -0.15, each week of account age -0.03.
- Cost of a call: $3.
About this page and calculator
The examples, weights and results are illustrations only, made up to show how the method works. They are not a prediction, a benchmark or a promise of any result on your accounts. The calculator is provided as is, without warranty, and you use it at your own risk; check its results before relying on them. Nothing here is legal, regulatory, compliance or financial advice. Decisions about which accounts to work, when and how often to contact consumers, and how to treat them stay with you and must follow the FDCPA, Regulation F, state law and your clients’ rules. TransUnion, Equifax and Experian are named only to describe their products, which may change; BestPair is not affiliated with or endorsed by them. Your copy of the calculator is yours: nothing you type into it is sent to BestPair, and you should not enter consumers’ names, account numbers or other personal details. Use of this page is governed by the site’s Terms.
Sources
- TransUnion introduces new recovery scores: insideARM, press release, 9 February 2011, on the Recovery Propensity and Recovery Yield Scores.
- Equifax, TransUnion unveil new debt recovery tools: Auto Remarketing, 14 February 2011, on Equifax Recovery Navigator and the TransUnion scores.
- PriorityScore for Collections: Experian product sheet on a likelihood-of-payment model and an expected-dollar model; a vendor’s description.
- Collection Triggers: Experian product page on alerts when events appear on a consumer’s file; a vendor’s description.
Common follow-up questions
What is a propensity to pay score?
A number from a scoring vendor that ranks how likely a consumer is to pay something on an account within a set window. TransUnion’s Recovery Propensity Score, for example, predicts whether an account will pay $50 or more within 12 months, and Equifax’s Recovery Navigator scores the chance of a payment within 12 months on a scale of 1 to 999. It is read from the consumer’s credit or public record file when you request it.
Is a propensity to pay model the same as a collection score?
Broadly, yes. Collection score, recovery score and propensity-to-pay score are names vendors use for models that rank accounts by their chance of paying, and some, such as Experian’s PriorityScore, add an expected dollar amount. An agency can also build its own propensity model from its own history; the weights on this page are a simple version of one.
Should we stop buying a vendor score?
No. For a consumer nobody has reached yet, the vendor score is usually the best information you have, and next contact value starts from it. It becomes a weaker guide once your collectors have spoken to the person, because what they learned on those calls is not in the file the score was read from.
Do we need a data scientist to do this?
Not to start. The calculator runs in a spreadsheet, and a first set of weights can come from comparing pay rates after each event. Fitting all the weights together from your own history, and checking them on a later period, is a job for an analyst who can run a logistic regression.
Can a vendor score be refreshed?
Yes. You can send the account again for a new score, and trigger products such as Experian’s Collection Triggers alert you when something like new employment or a new credit line shows up on the file. Both react to changes in the consumer’s file, not to what happened on your calls.
Does BestPair change which accounts we call, or the order?
No. BestPair changes only which collector works an account. The agency keeps its scores, its call order, its offers, its contact rules and its call frequency.
See it on the main site
Two minutes
Watch the explainer
What your dialer does with the next account, what pairing changes, and what the Floor Assessment measures. With captions.
Watch the videoYour floor
Try the calculator
Three numbers off your dialer and collections reports give an illustrative figure for your floor. It is at best informed guesswork until your own history is measured.
Open the calculatorWhat you get
See the sample report
The report the Floor Assessment delivers, page by page, built on a fictional floor with synthetic data.
See the report
Would it be a bad idea to spend 45 minutes finding out?
If your shop does not qualify, you will hear it on the call, not after you have paid for a report.
Book a 45-minute fit call